China Deploys AI to Map Every Solar Farm and Wind Turbine
AI catalogues 320,000 solar sites and 92,000 wind turbines, giving China a national view of renewables as data‑center demand surges.
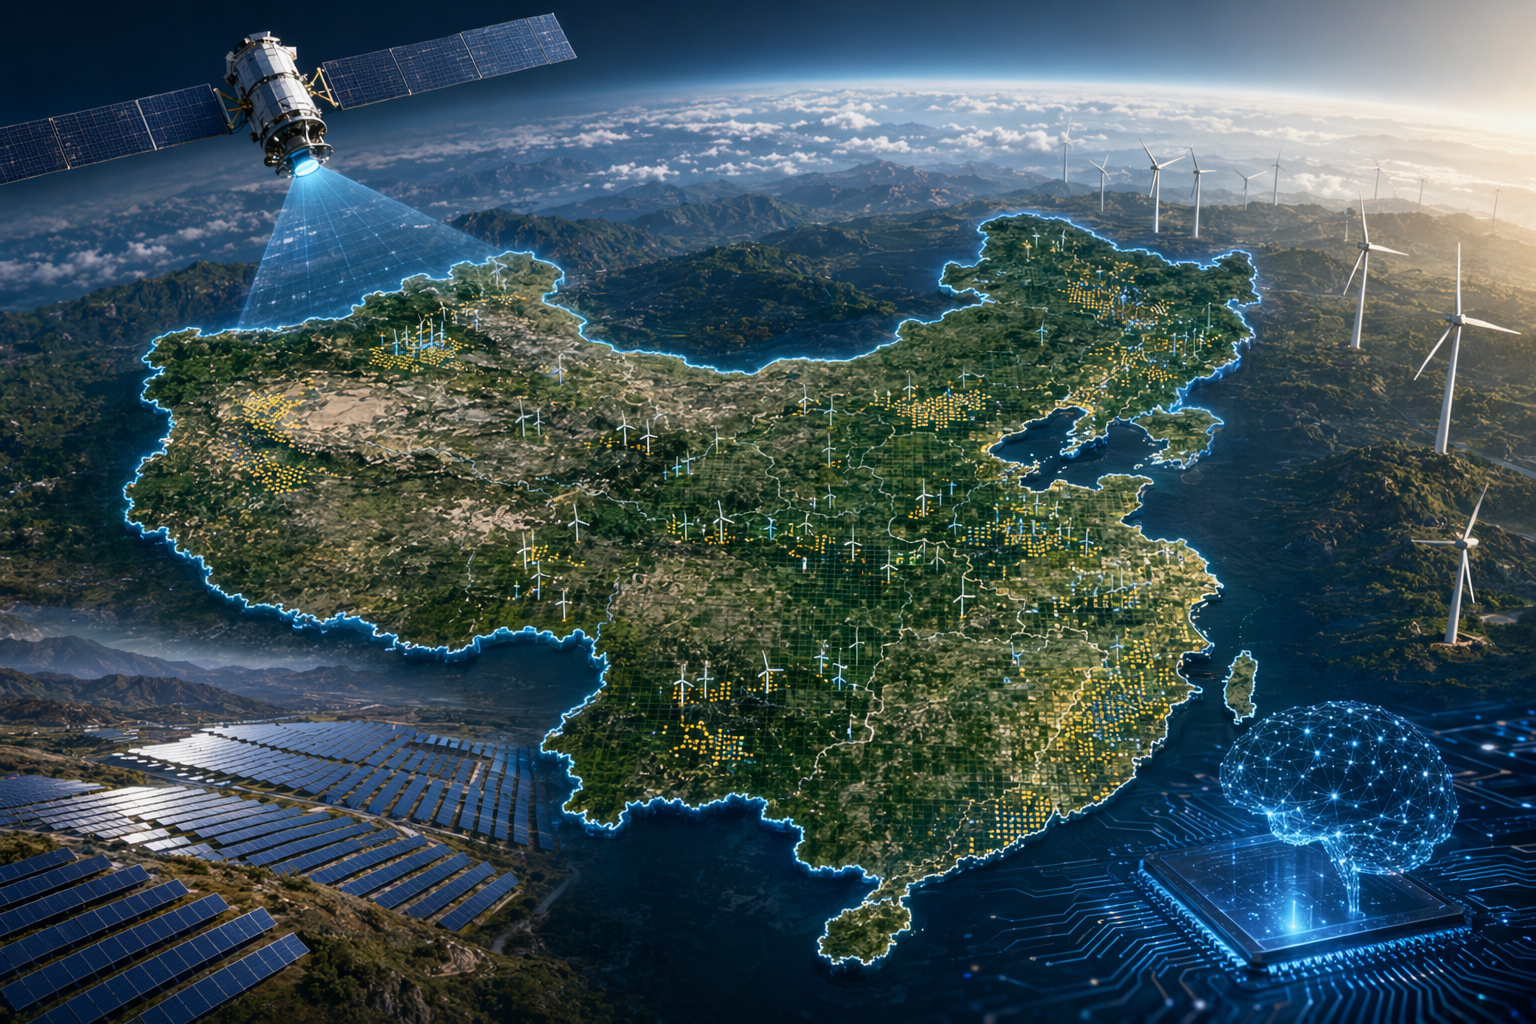
AI-generated visualization of satellite imagery mapping solar panels and wind turbines across China
*TL;DR: China’s AI system identified 319,972 solar PV installations and 91,609 wind turbines, creating a national‑scale renewable inventory as data‑center power use jumps 44% YoY.
Context
Grid operators worldwide are grappling with AI‑driven electricity demand that outpaces infrastructure design. In the United States, capacity market prices have surged tenfold in two years, while Europe rushes to upgrade transmission lines for hyperscaler loads. The International Energy Agency warns that global data‑center consumption could near 1,000 TWh by 2030. China now possesses a tool that could help it balance renewable output against that surge.
Key Facts
A deep‑learning model trained on sub‑metre satellite imagery processed 7.56 TB of data to locate every major solar photovoltaic (PV) facility and wind turbine across 1,915 counties. The effort produced a catalog of 319,972 solar PV sites and 91,609 wind turbines, the first complete, high‑resolution inventory of a nation’s renewable assets. Researchers from Peking University and Alibaba’s DAMO Academy released the dataset publicly, enabling replication elsewhere.
Liu Yu, a professor at Peking University, described the result as giving China a “God’s‑eye view” of its new‑energy landscape, allowing operators to see assets previously hidden in provincial silos. The study shows that pairing solar and wind farms across distant regions—such as solar in Gansu with wind in Inner Mongolia—significantly smooths generation variability, reducing the need to curtail (waste) renewable power.
Meanwhile, China’s data‑center sector consumed 22.9 billion kWh in Q1 2026, a 44% year‑on‑year increase, according to the China Electricity Council. The growth concentrates in northern and western provinces where land is cheap and renewable resources are abundant, precisely the regions where solar‑wind complementarity is strongest.
What It Means
National‑level visibility lets grid operators match complementary solar and wind output in real time, stabilising supply and lowering curtailment costs. By moving coordination from provincial to countrywide scales, China can more efficiently integrate its $2.26 trillion renewable economy and mitigate the strain from rapidly expanding data centres.
The public release of the inventory and its code offers a template for other economies facing similar AI‑driven demand spikes. Watch for pilot projects that use the dataset to automate dispatch decisions and for policy moves that shift grid management from regional to national frameworks.
Continue reading
More in this thread
Conversation
Reader notes
Loading comments...